 monthlet
 is a note app where you write and grow notes through AI chat.
There are two places to put numbers in monthlet: a table placed inside a note, and a spreadsheet document created as a separate document from any note. They look similar, but they have different roles.
A table is one of the blocks you can place in a note, and it has no formulas. The calculations a table can do are per-column sum, average, minimum, and maximum. If you want to reference other cells in a calculation, use a spreadsheet document instead. Those support formulas starting with =, can hold multiple sheets, and support formatting.
Both have been there since the first public release. Table editing has to be turned on in settings, so let’s start there.
Click a table to edit it
A table in a note is shown as an ordinary table at first. To make it editable, turn on “Enable editable tables” under “Advanced” in settings. It is off by default.
With it on, clicking a table switches it to an editing grid even while you stay in Read mode. Fix a cell, click outside the table, and the change is committed and the table returns to its normal appearance. Only the one table you clicked goes into the editing state at a time. In Edit mode, every table in the note opens as a grid from the start.
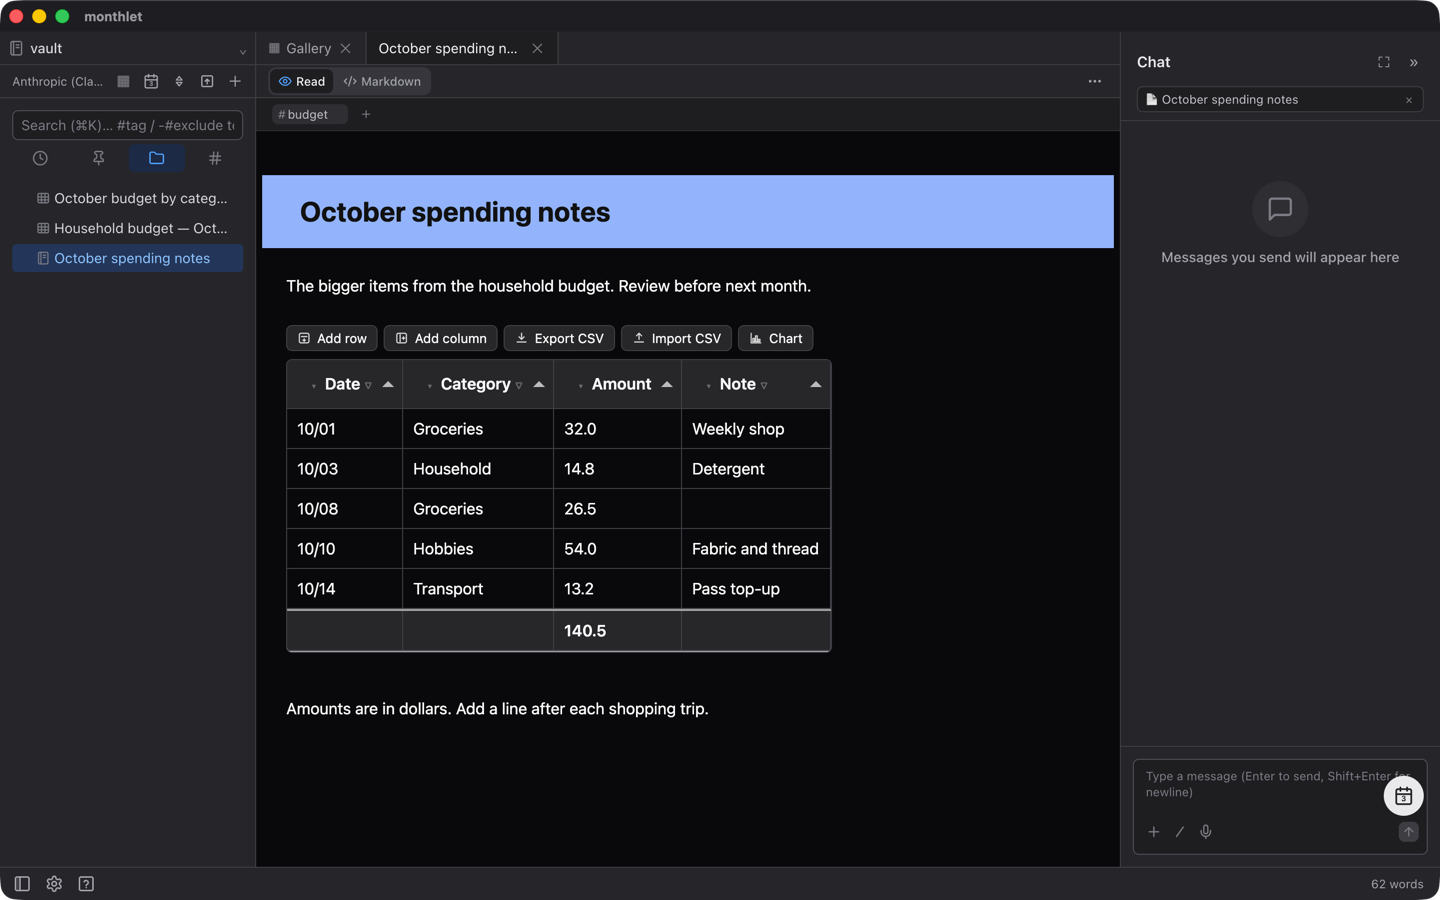
Clicking a table also selects that table as the target for chat. You can fix it by hand, or ask chat to “add a row”, against the same table.
Turn the option back off and all tables return to their normal display. Sort and aggregation settings are kept.
What you can do in the grid
Above the grid are “Add row”, “Add column”, “Export CSV”, and “Import CSV”. “Import CSV” reads the first line of the selected file as the header.
Click a column header to sort by that column. Row and column order and column width can be changed by dragging. The ▾ in a header offers “Rename column”, “Delete column”, and “Group by this column”. Aggregation is here too: choose “Sum”, “Average”, “Min”, or “Max”, and the value appears in that column’s footer. The ▽ is filtering, where you pick what to show from a checklist of values. To remove a row, right-click it and choose “Delete row”.
When there is a numeric column, “Chart” also appears. Choose “Bar”, “Line”, or “Pie”, and a chart block is inserted right after the table, with the original table left in place. What goes into the chart is a copy of the values at that moment. The chart types, and how to link a chart to a spreadsheet, are covered in a separate article.
Creating a spreadsheet document
A spreadsheet document is a document type alongside notes. Press the “+” in the sidebar and three items appear, “New note”, “New spreadsheet”, and “New folder”; choose “New spreadsheet”. Right-clicking an empty area of the sidebar list shows the same three items.
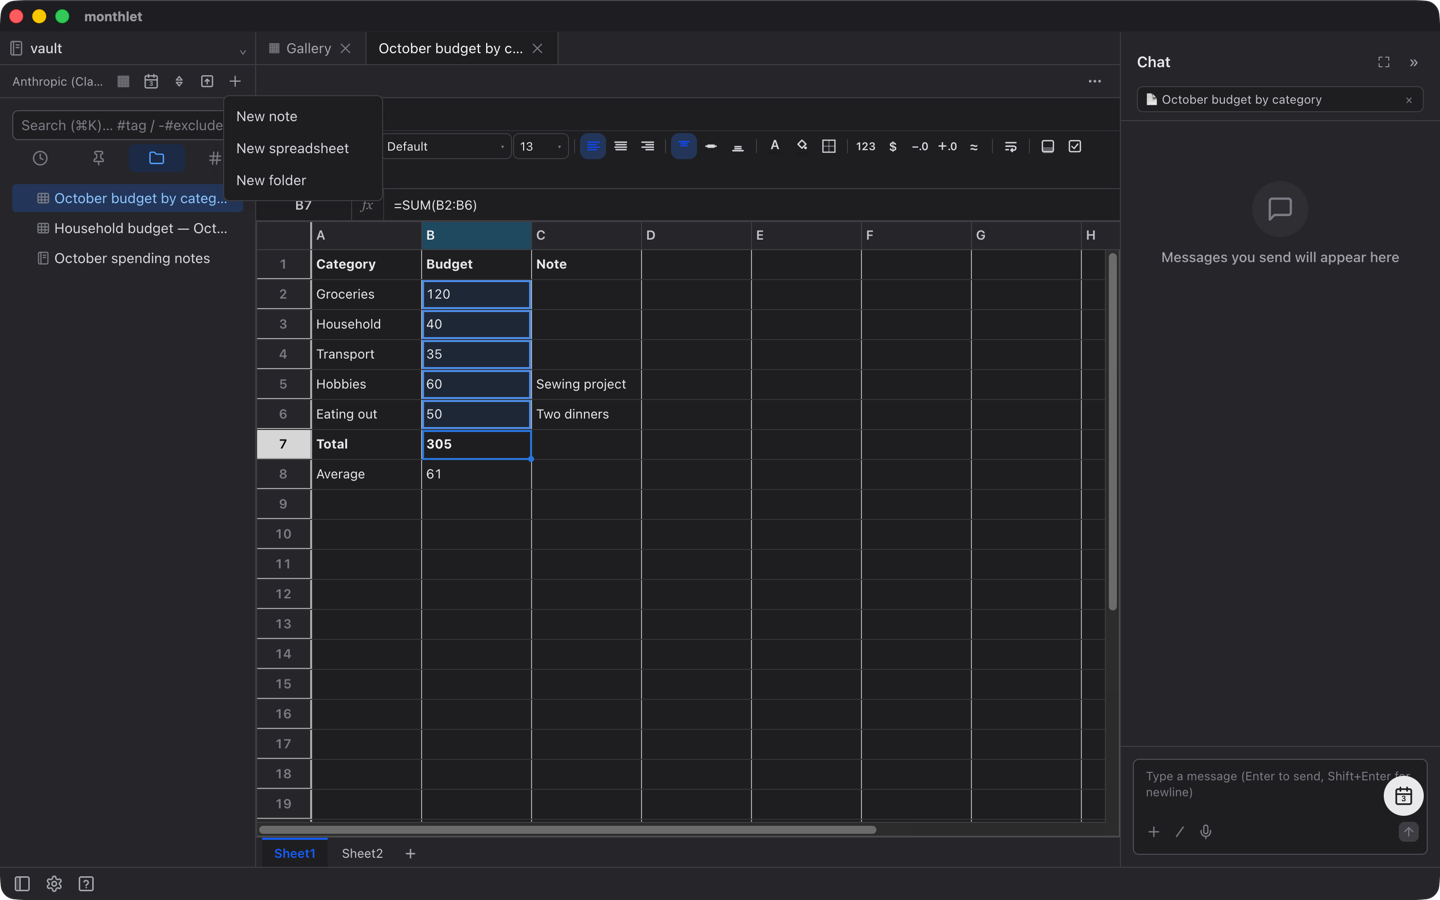
The document you create appears in the list with a table icon. Like a note, it can go in any folder in your Vault.
To start from a file you already have, choose “Import” from the document’s “⋯” menu, then “Excel / CSV / TSV…” to load a file. Importing from Google Sheets is here as well (covered in an earlier article). You can also ask chat to “make a spreadsheet from these numbers”.
Formulas and formatting
Start a cell entry with = and it becomes a formula. There are 312 functions available, and candidate function names are suggested as you type. Cells on another sheet can be referenced as Sheet2!A1.
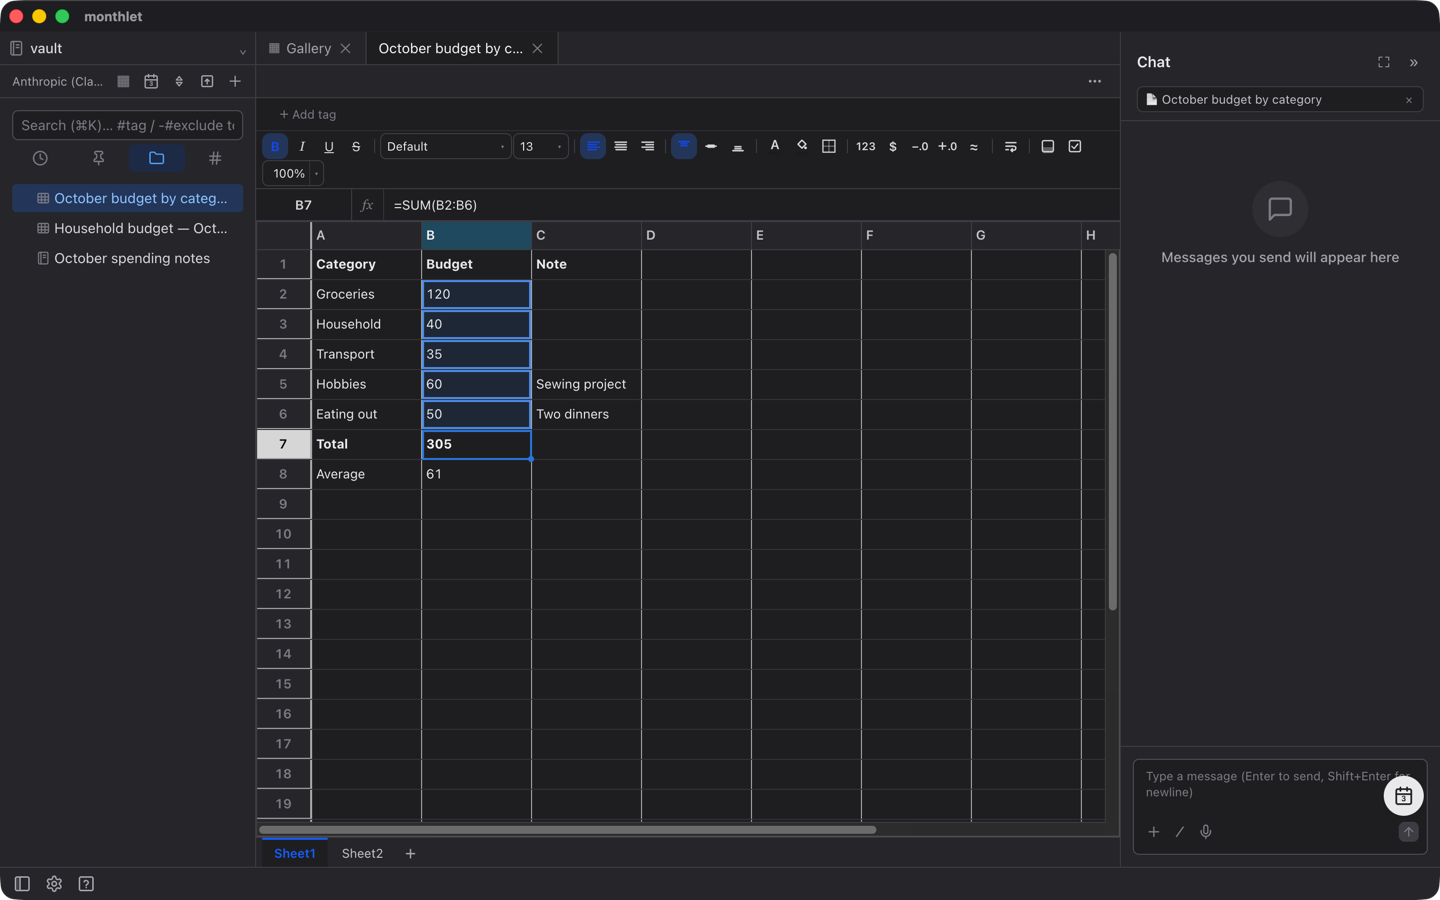
Since 1.1.0, copying a formula cell and pasting it into another cell shifts its references to match the paste location. References written with $, such as $A$1, do not move.
Cells can carry formatting: bold, italic, alignment, font, text and background color, number formats (currency, percentage, date), borders, and more. There is also conditional formatting that changes color based on the value, data validation that restricts what can be entered, cell notes, and merged cells.
A single document can hold multiple sheets. Besides adding, duplicating, and reordering tabs, you can also move a sheet to another document.
The contents of the open sheet can be read from chat. Sheets that are not open can be read too, if you specify them by file name. Beyond reading, you can ask chat to sort, write to cells, insert and delete rows and columns, and change formatting. Ask it to “sort by amount, largest first”, and it sorts that way.
Filtering and sorting
In 1.1.0 we added conditions and search to filtering in spreadsheet documents, and ranges and multiple criteria to sorting.
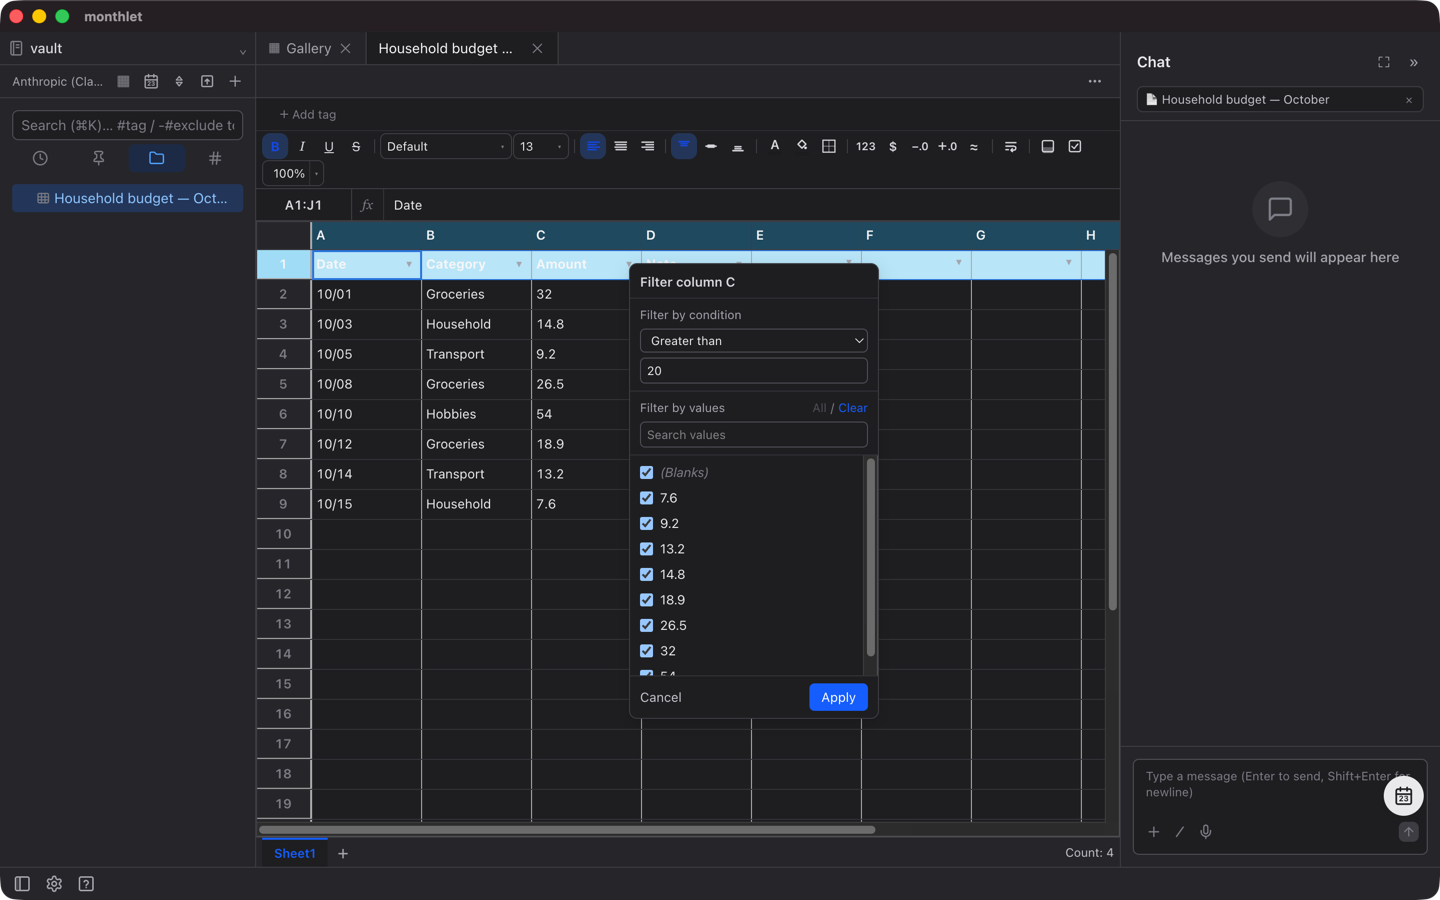
To filter, right-click the row number of the row you want as the header and choose “Create filter”. Press the button that appears on a header cell to open that column’s filter. Besides unchecking values in the list, you can use “Filter by condition” to set a condition such as “Greater than”. You can compare numbers, use ranges, check whether text contains something, or check whether a cell is empty. If you specify both a condition and values, only rows that satisfy both remain. For a column with many distinct values, the “Search values” field narrows the list.
To sort a range, select cells across two or more rows, right-click, and choose “Sort range…”. Under “Sort by”, pick a column and ascending or descending order, then use “Add sort column” to add another criterion; rows that tied on the previous criterion are ordered further by the next one. Turn on “First row is a header”, and the first row stays in place while the column choices show the header text.
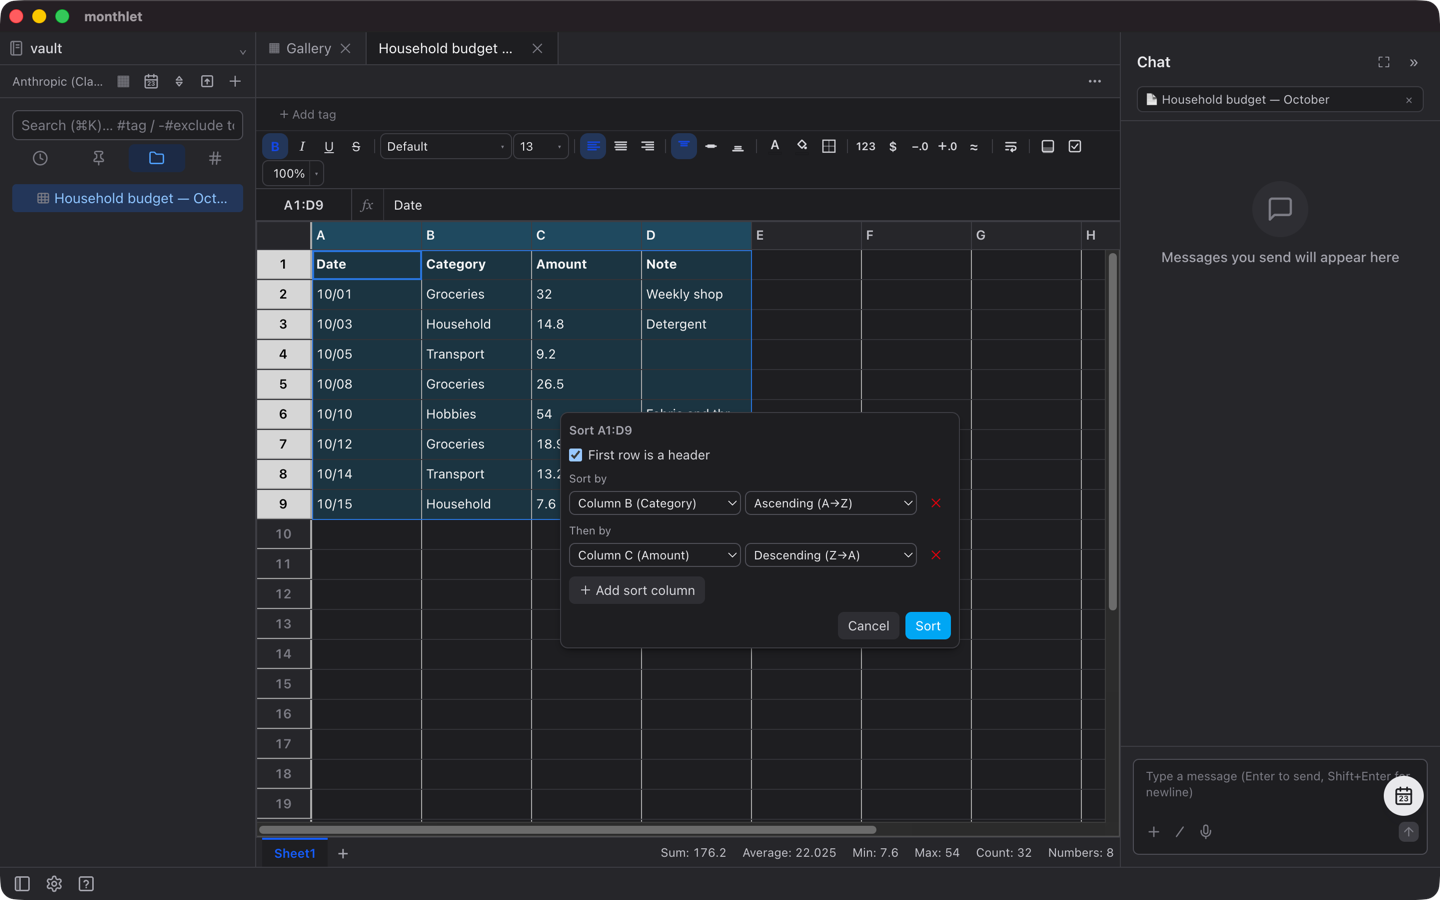
If the selected range covers only some columns, only the cells in those columns move. Another table placed next to it on the same sheet does not move.
Converting a table into a spreadsheet
Sometimes you start something as a table in a note and later want formulas. In that case you can convert the table into a spreadsheet.
This is also enabled in settings. Turn on “Enable converting tables to spreadsheets” under “Advanced”, and right-clicking a table shows “Convert to spreadsheet”. You can stay in Read mode.
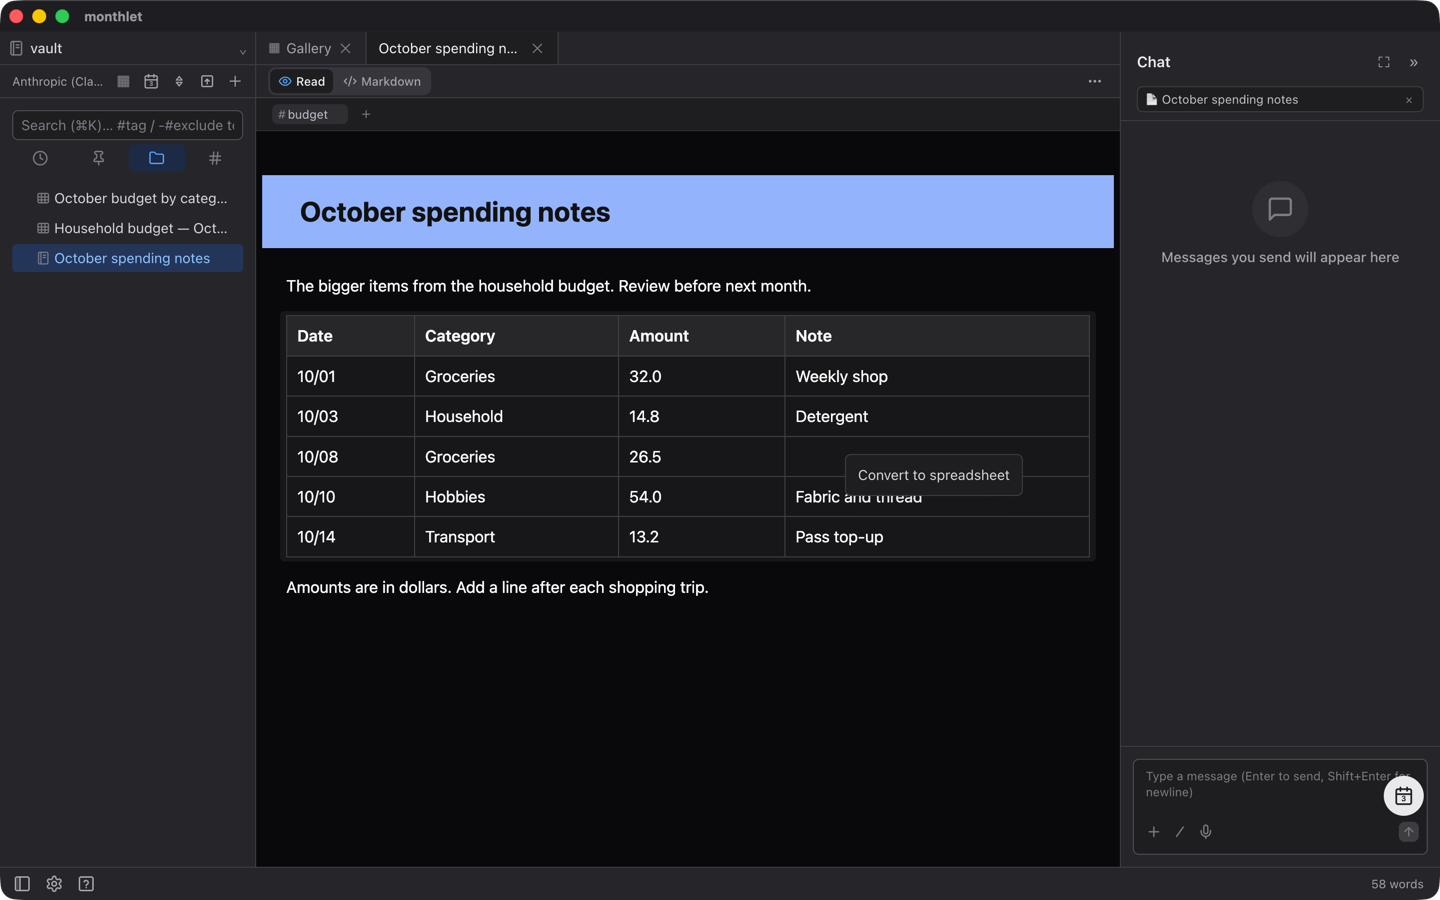
Choosing it creates a new spreadsheet document in the same folder. The conversion is a one-way copy; there is no link between the original table and the new document. The same applies to data imported from Google Sheets: you get an independent document holding the values as of the time of import.
How they are stored
Both tables and spreadsheet documents are saved as ordinary HTML files.
A table in a note is written into the note’s HTML body as a table element. The sort and aggregation settings live in the same file. Opened in a browser, or seen as a thumbnail in the list, it looks like an ordinary table.
A spreadsheet document is also one HTML file per document. The data including formulas and formatting is held inside the file, and the body contains an ordinary table. xlsx is a format used for import and export, not for storage. Export options are Excel (all sheets), CSV (one sheet), and PDF.
Since 1.1.0, exporting to Excel also exports filters and data validation. Importing an Excel file reads those two as well.
Try it
monthlet runs on macOS (Apple Silicon) and Windows. The Windows version is available from the Microsoft Store. Enter your own AI API key and all features are available.